![]()
|
|
|
© all pages from this
website are copyright PA0EHG
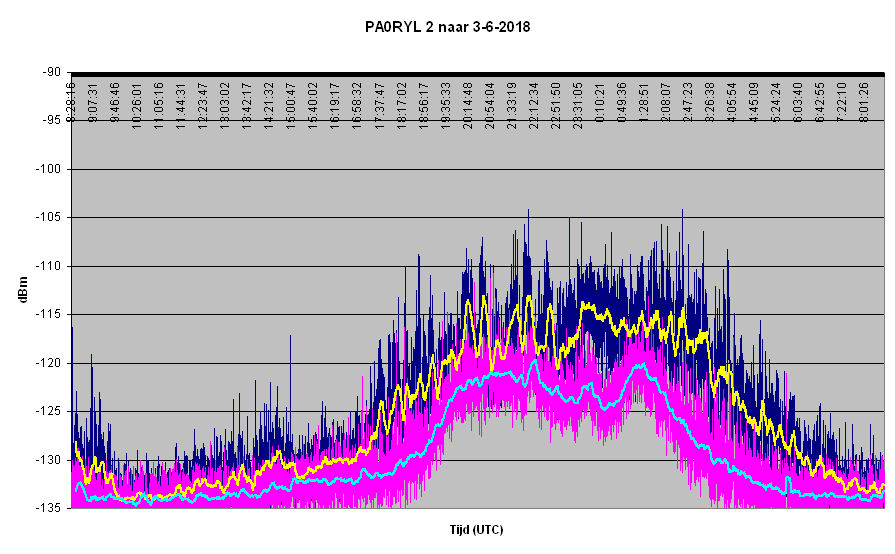
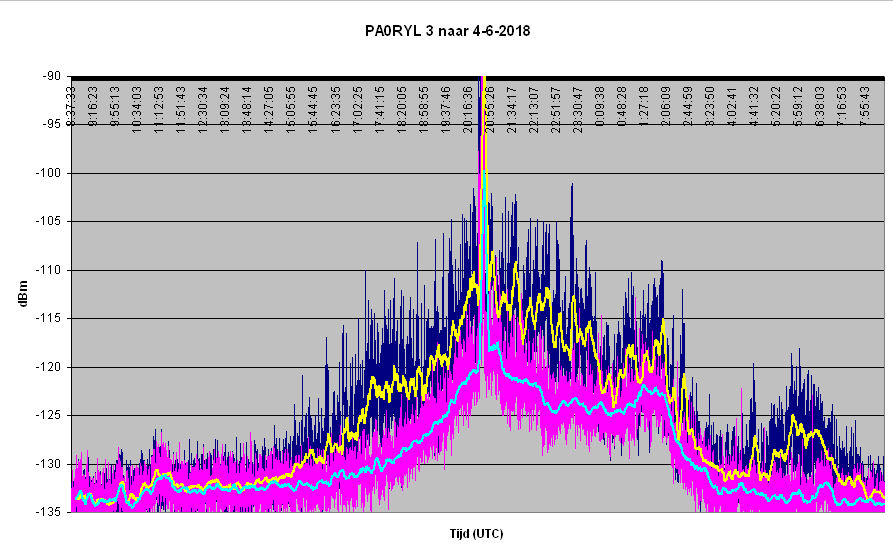
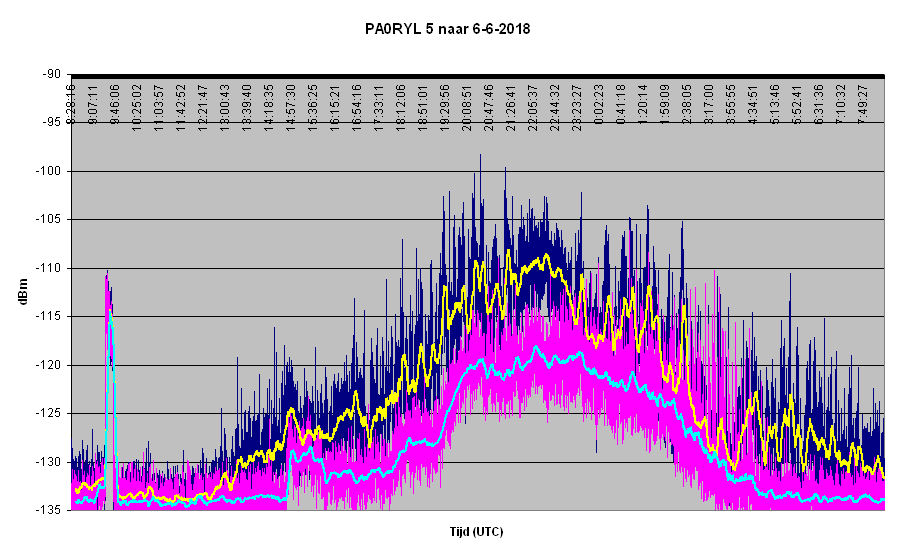
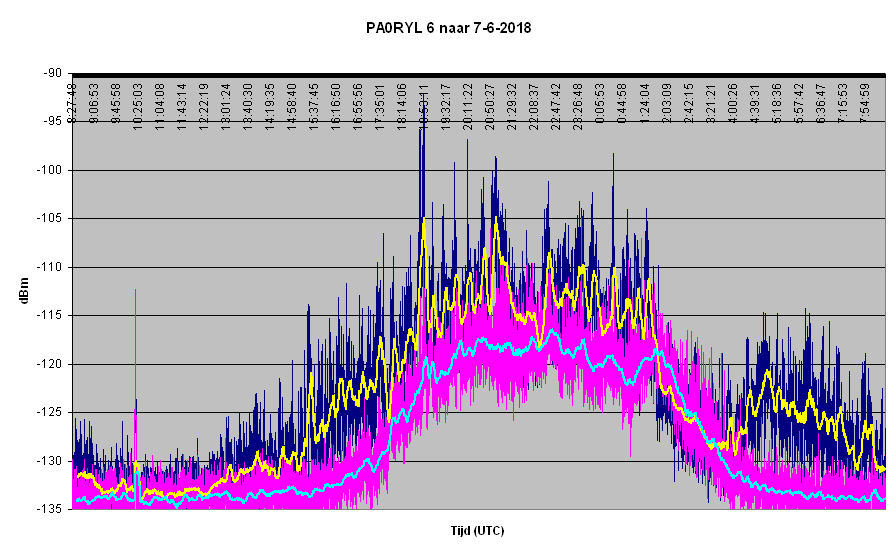
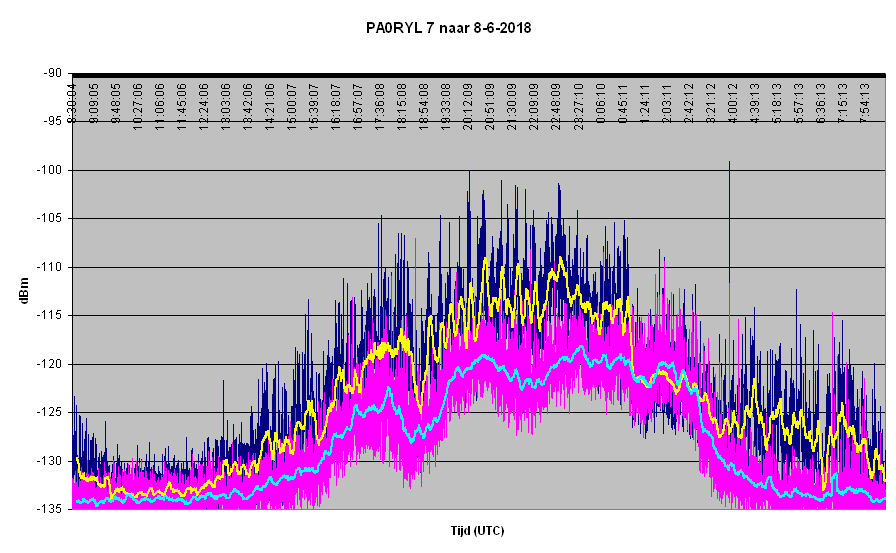
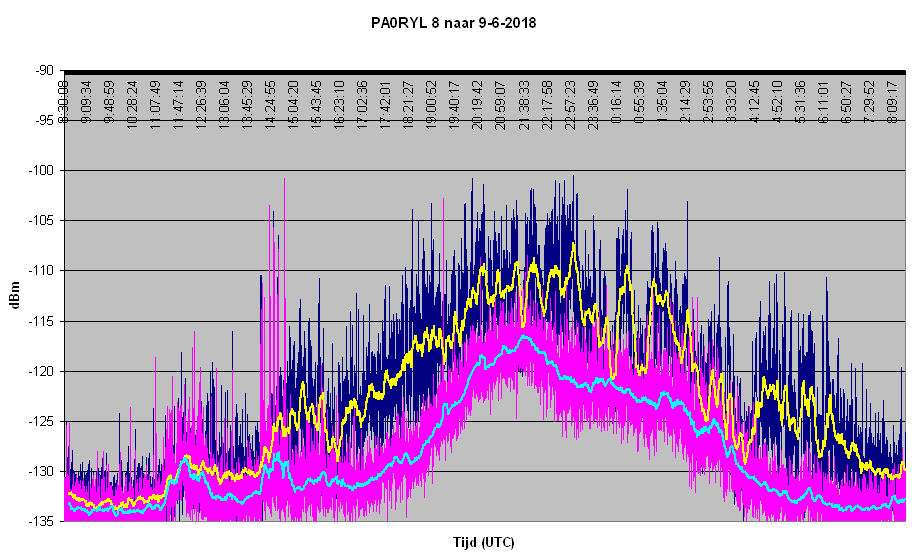
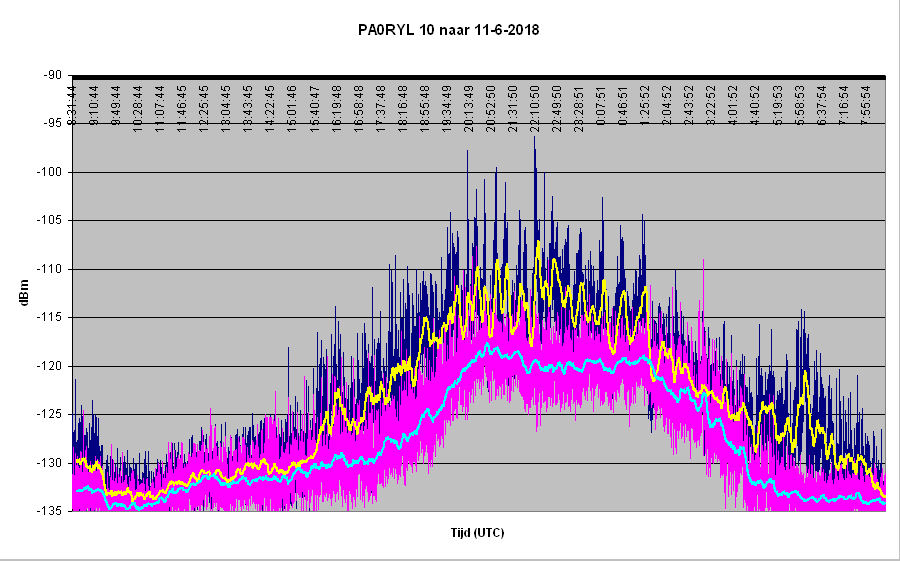
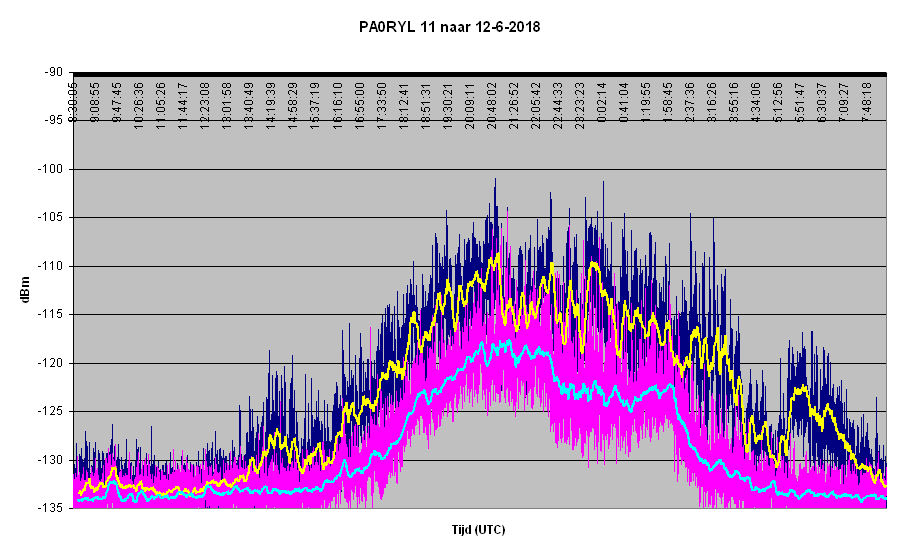
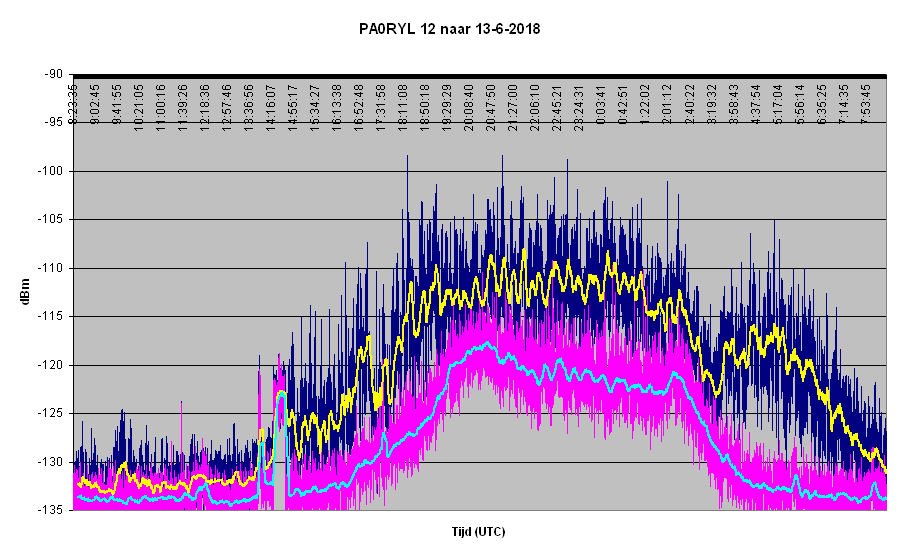
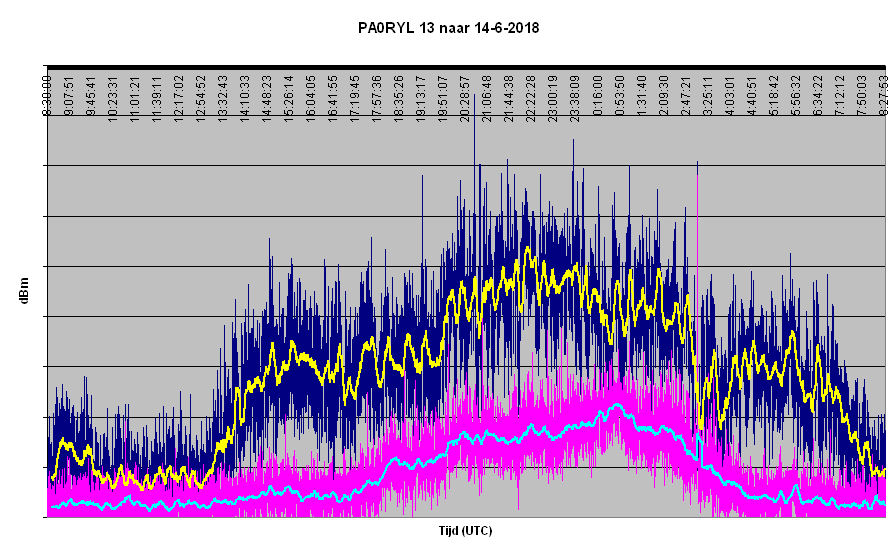
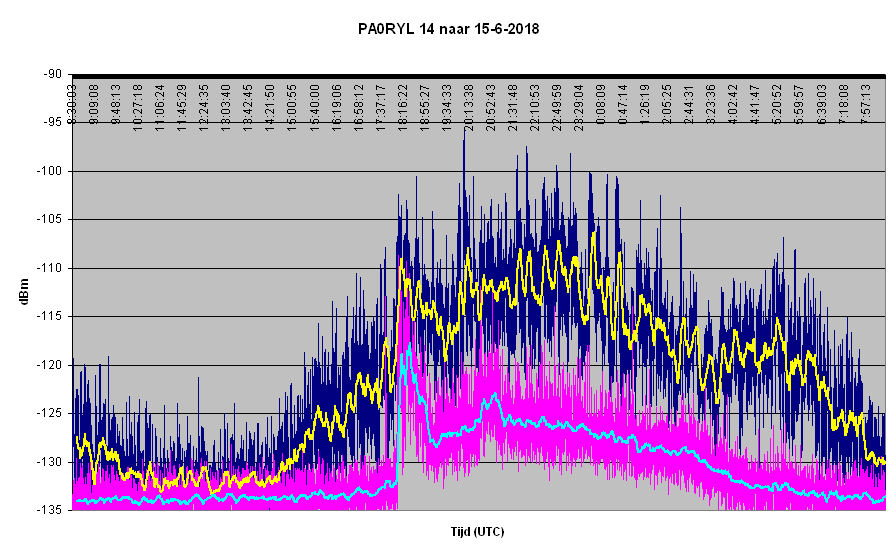
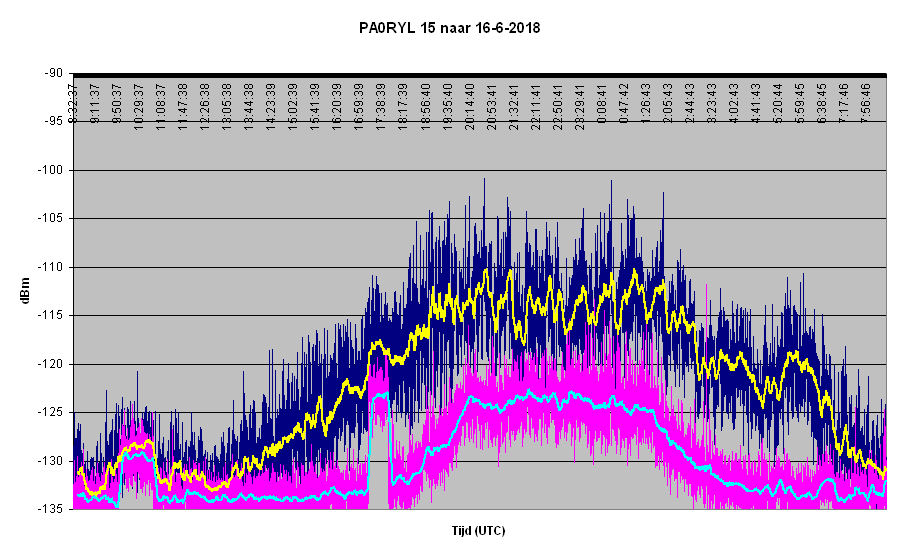
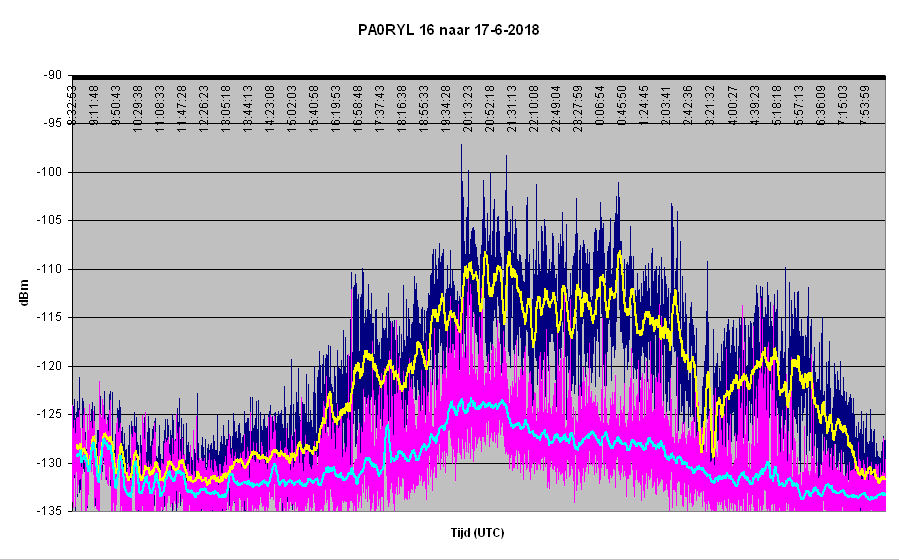
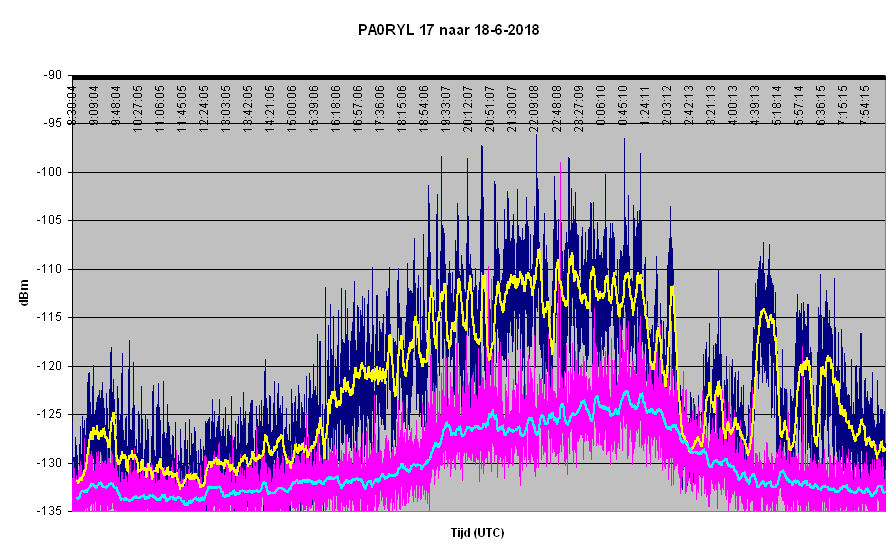
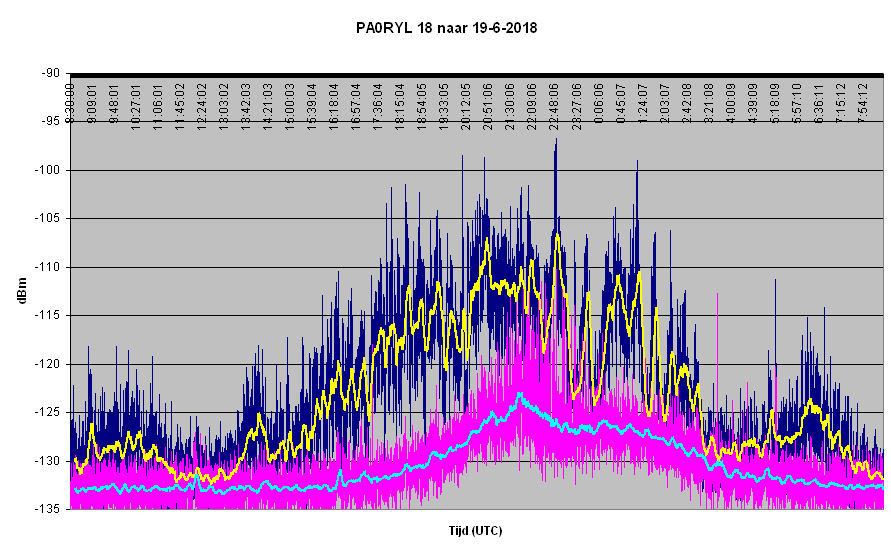
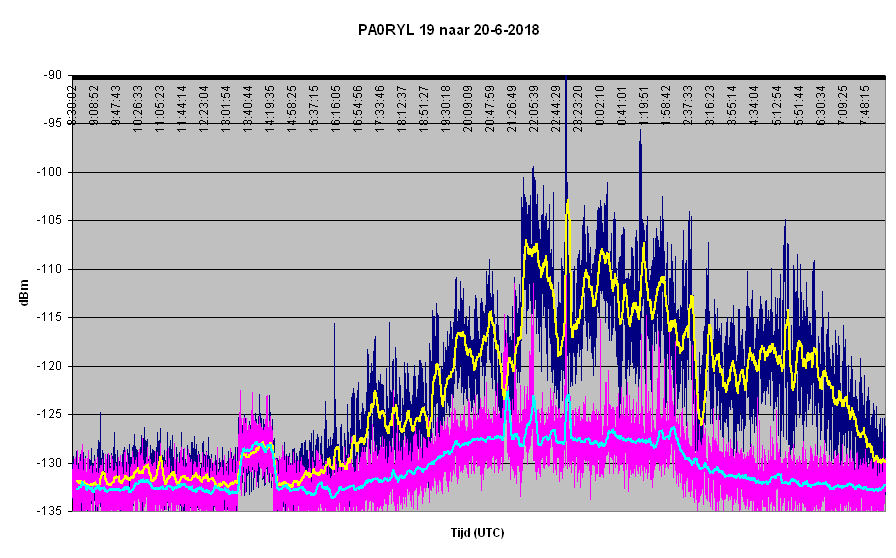
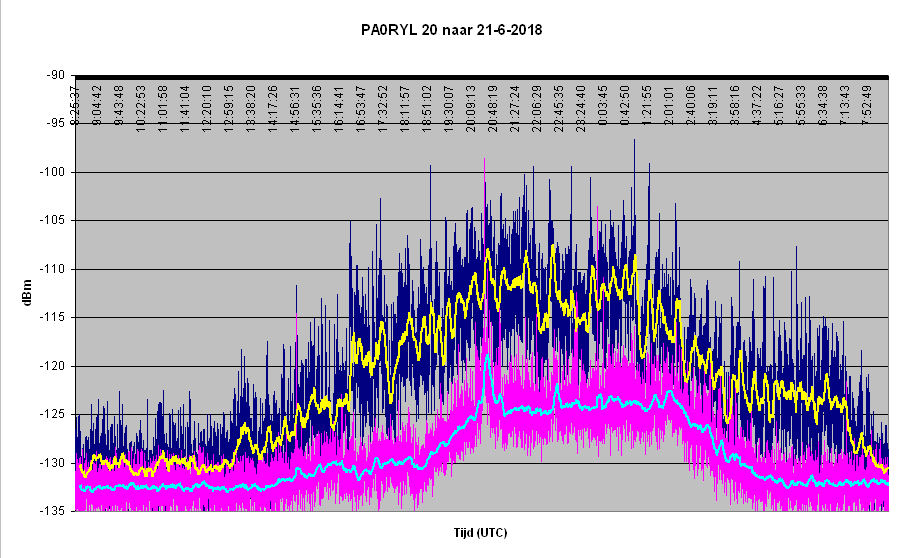
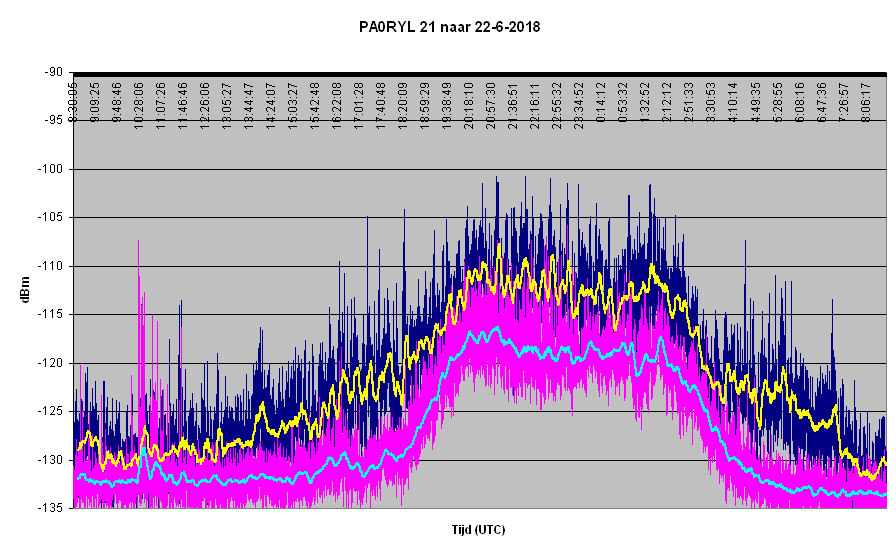
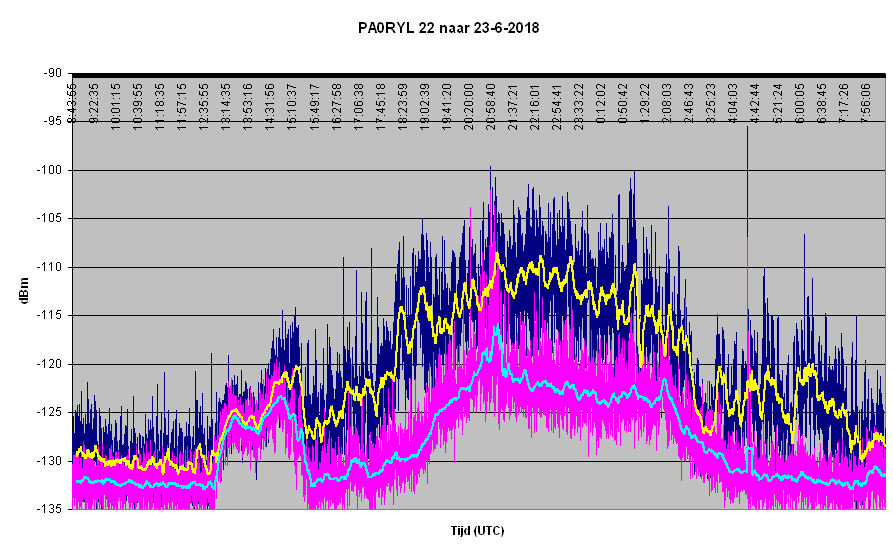
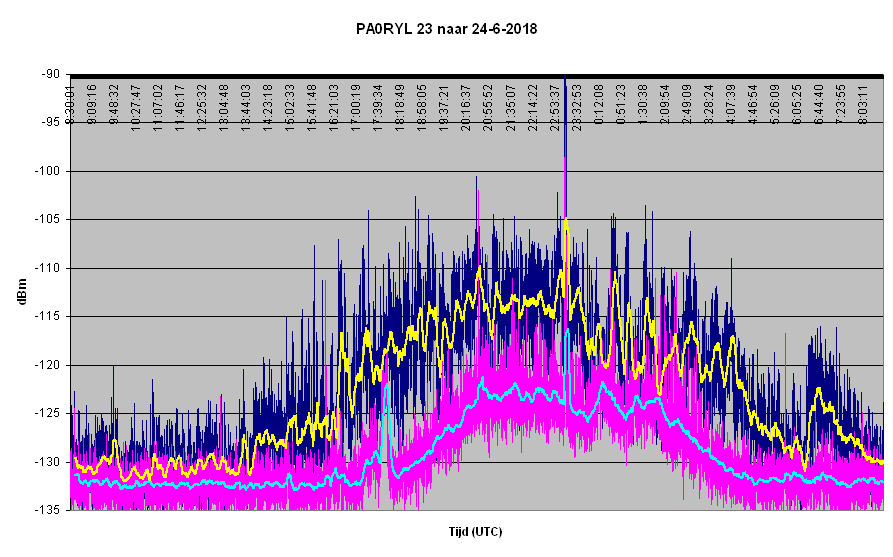
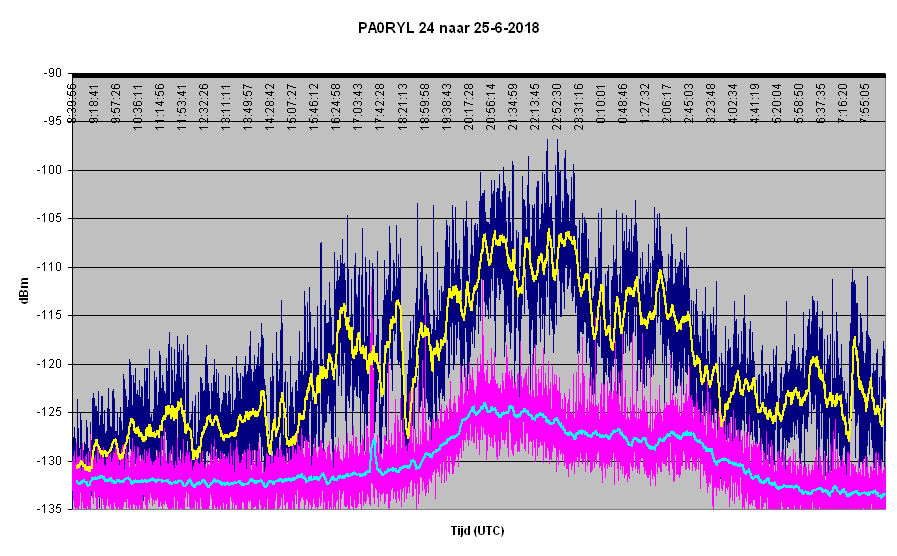
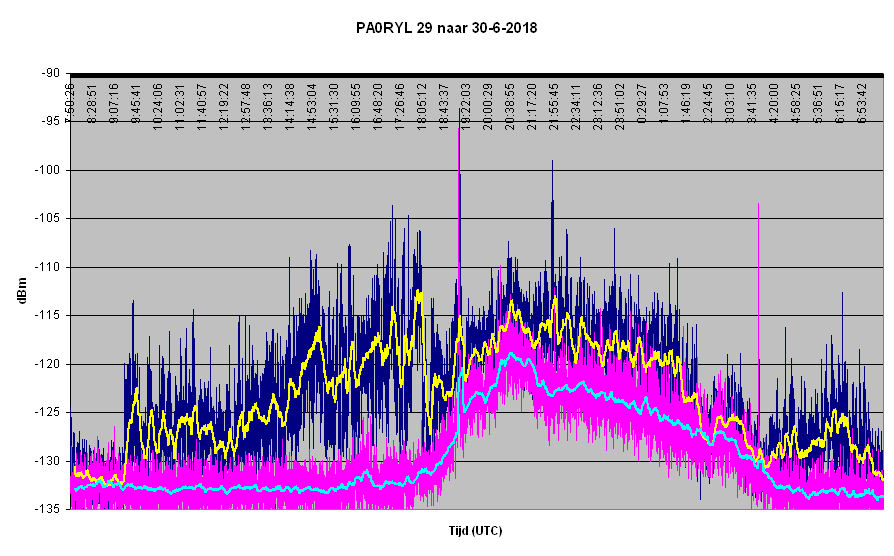
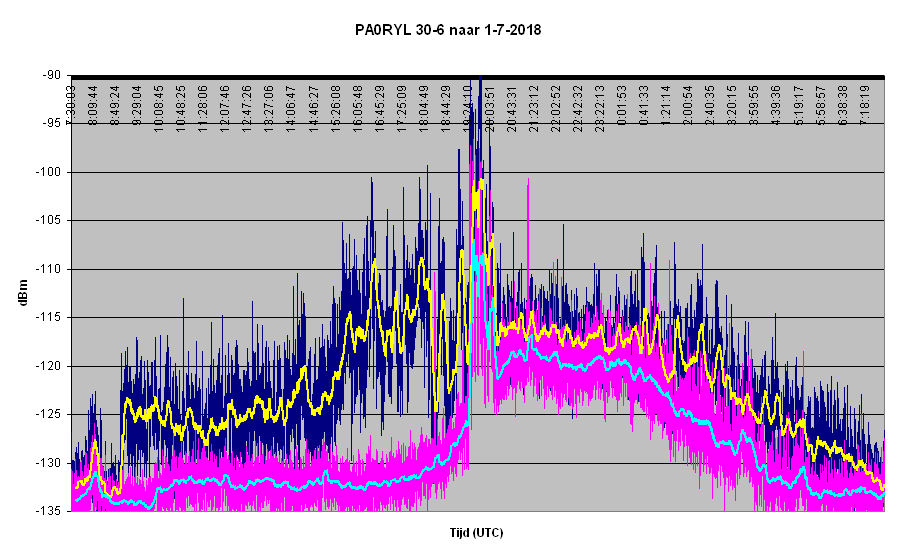
These are the results from my measurements: last update 02-08-2018 The Blue graph is the 17280 measuring points from the Beacon The Pink graph is the 17280 measuring points from the Noise The Yellow line is the avaraged signal from the Beacon The LightBlue line is the averaged signal from the Noise
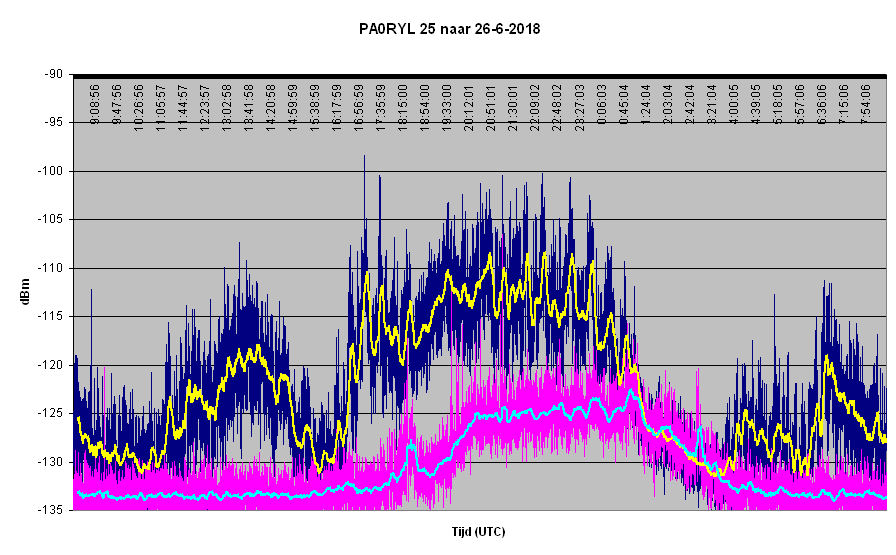
Thunderstorms; probably beacon switched off until 19 UTC
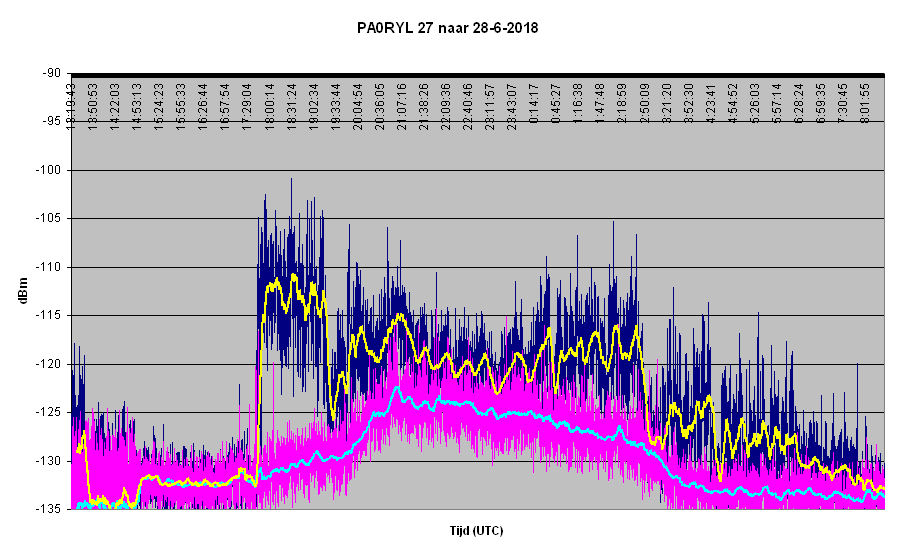
Strange jumps in beacon recorded power ? after 07 UTC on 27-6 logging blocked, needed restart.
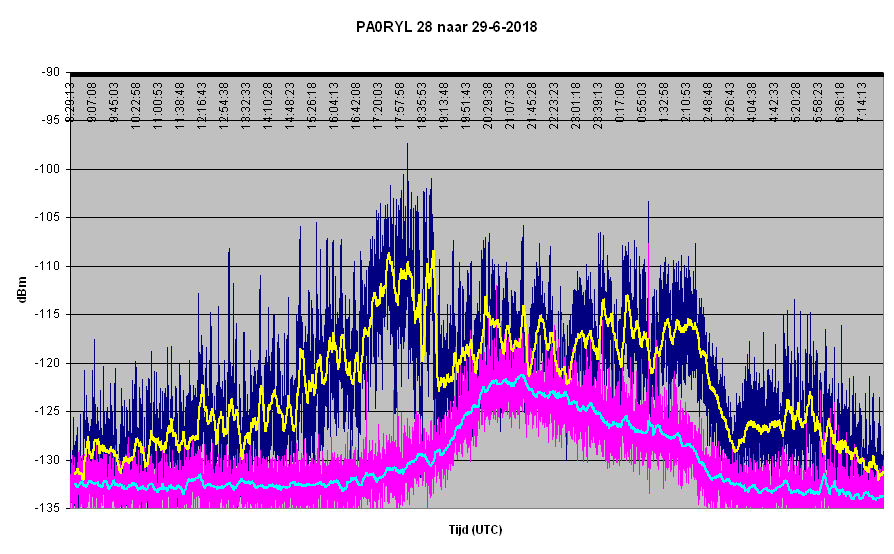
Logging not 24 hrs due to beacon unreliable, after 17.30 UTC beacon worked reliable
© all pages from this
website are copyright PA0EHG
|